Friday, December 29, 2006

Today's Trade: GROW

I went short 400 shares GROW at $71.95.

It's always risky shorting high flyers like GROW, so I am using a tight stop on this trade. The setup was one that I like to use to spot weakness in stocks that have made parabolic moves. When a stock makes a new high, but RSI does not confirm the new high, it's a sign that the trend, at least in the very near term, is weakening. Here, RSI is about 10 points lower than when the stock made new highs both earlier this month and in November. The safe way to play this would be to wait for the stock to drop below the old highs. I'm using a more aggressive, and riskier, style today. The fact that the stock is stuggling on an up day convinced me to enter early.

Thursday, December 28, 2006

Trade and Chart: QID

When I'm in the mood to short the Nasdaq, instead of shorting the Q's, I like to go long QID. QID is an ETF that double shorts the index. It's a great way to increase your exposure to volatility when playing a boring index. Today I bought 500 shares at $53.90.

Looking at the chart, we see that the ETF recently burst through its downtrend line on very good volume, and has pulled back on weak volume--a very bullish sign. The RSI is also particularly strong.


Wednesday, December 27, 2006

Books, Indicators and current charts: answering e-mails

Why haven't you posted any charts or watch lists lately?

Due to factors such as low volume, this time of year can make for tricky trading, and I've noticed that charts don't hold up well. I'm still watching the usual suspects, but I don't feel there are many really strong charts right now. Once we get into the New Year, we'll be back to normal and I'll be posting tons of charts.

Can you recommend 2-4 good books that you have read about trend trading and/or short term trading?

Here are a few of my favorite trading books:

The Master Swing Trader by Alan Farley:
This book is not an easy read, but if you stick with it you'll find some really good tips and trading setups.

Trading in the Zone by Mark Douglas:
I managed to pick up a few nuggets from this book. The most important was understanding how our decisions are based on our belief systems.

Getting Started in Chart Patterns by Thomas Bulkowski
:
If there was only one book I could read, it would be this one. Great analysis of chart patterns.

I am currently reading Brett Steenbarger's new book, Enhancing Trader Performance. It's been a real treat so far, and I hope to have a review posted in the coming weeks.

What one indicator could you not live without?

To be honest, I really don't need any indicators, even though I monitor a few. Support and resistance, price bars (candlestick), patterns and volume are much more important for my style of trading. However, I do like using RSI for measuring divergences, stochastics for monitoring extremes and bollinger bands for volatility readings.


Monday, December 25, 2006

Self Awareness and Trading


After writing Market Wizards (where he interviewed many top traders), Jack Schwager decided that one of the most important factors to trading success is knowing thyself and finding a trading style that matches the trader. Over the years, I've learned the hard way that this is sage advice.

Early on in my swing trading career, after reading thousands of pages on the subject and successfully paper trading, I decided I would be an intermediate term trend follower. As a paper trader, I made over 200 percent gains over a six month period. Making money was so easy, I was already researching the boat I was going to buy with my real gains!

Unfortunately, playing the game with real money did not have the same results. My first three months, I was up only 3 percent and was trailing the major indices. Worse than that, I had left a lot of money on the table. Instead of sticking with those intermediate trades, I was selling on any spike up or down. I had picked a few big winners that would have made me a mint, but had bolted too early.

I knew what my problem was, yet no matter how hard I tried, I could not get myself to stop constantly checking my positions. I came to the realization that by nature I'm a risk taker that craves action. This is not the best way to conduct yourself when trend trading, and after a few months of this I realized I was not cut out for this style of trading. Since then, I've switched to short term swing trading, holding positions anywhere from 1 day to a few weeks. While I still battle the urge to micro-manage my positions, I am much more comfortable with the shorter time frames and success has come much easier.

There is an infinite number of ways to make money in the markets, but each system requires a specific skill set and psychological make up. It's imperative that you find the system that fits you. If you know yourself and match that knowledge with the right system, your probability for success will skyrocket.

{If you linked here from another site, thanks for visiting and please visit the rest of my site.}

Sunday, December 24, 2006

The Shins: Phantom Limb

I first took notice of The Shins after watching Garden State. Here's yet another winner:

Friday, December 22, 2006

Tighten the purse strings and advice from Rocky Balboa

"Don't focus on making money; focus on protecting what you have. "

--Paul Tudor Jones--

The market is at a crossroads right now, with all of the major indices at key levels heading into the new year. I will be following Mr. Jones advice and playing it very cautiously. While I will continue to trade, I will play it much safer. Unless I see something that moves me to make a big play, I will most likely use smaller position sizes with high risk reward and tight stops. Today's position in GLD is a good example.

My main concern with the current state of the market is the fact that semis, transports and breadth are not confirming new highs. Couple that with the fact that money is flowing out of momentum plays (AAPL, AKAM) and into safe stocks like GE, and you can see why it might be time to tighten the purse strings a bit.

While these are legit concerns, I won't let them paralyze me from putting on trades. However, they will be on the back of my mind and effect my risk and position sizing.

Here is from sage advice about life that could be applied to the markets from Rocky Balboa:


Trades and Time Management

I bought 500 shares of GLD at $61.40. In all honesty, the stock is a mixed bag technically. On the positive side, we have the 50 day crossing the 200 day moving average, MACD is improving and the stock held up at it's gap point. Negatives include a power spike to the downside earlier this week with a low volume rise (dead cat bounce?) and weak RSI. What I like about the trade is that I can use a low risk entry, with a stop placed just under the 200 day MA at $61, which also happens to be where price action would dictate placing a stop. The upside target is $64, which would give me a 10:1 risk/reward, losing $.40 to try to gain $4.00. Not bad.


Those of you in need of some time management help, read what Steve Pavlina has to say about triage.

Wednesday, December 20, 2006

TRMP as possible short play

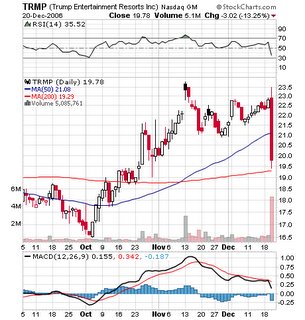
The Donald had a bad day today, as his stock, TRMP (Trump Entertainment Resorts, Inc.) took a big hit on heavy volume that broke a nice looking trendline and the 50 day MA. I might be tempted to short this stock off of a "dead cat bounce" towards the moving average.

Tuesday, December 19, 2006

Tonight's Watchlist: PRU, COP, SAFM, COG, BYD, AKS

As usual, tonight I took a look at the top 10-20 sectors over the past 30 days. Did anybody know the "meat" sector was in the top 10? Maybe that's why my holiday prime rib cost me 66 bucks. Yikes!

As my surprise about the meat sector shows, this is a great way to find sectors and stocks that are hot, but somehow flew under the radar. It's also an excellent way to find both stocks in uptrends and stocks that have bottomed and are in the midst of a first push upward. As I've explained before, I don't like to use many complicated scans. Instead, I look at the best sectors (worst sectors for shorts), and eyeball the charts. If a stock passes the eye test, it gets on my "further scrutiny" list, where I look more closely at technicals. Here are six stocks from the best sectors that made my watchlist: PRU (insurance), COP and COG (oil), BYD (casinos), SAFM (meat) and AKS (steel).

Monday, December 18, 2006

Today's Trade: PENN

I bought 500 shares PENN (Penn National Gaming, Inc.) at $41.06. I usually like to wait for stocks to pullback after breakouts over resistance, but the volume was so strong towards the end of the day that I suspect we could see more upside without a pullback. Even if the stock does pullback, I'll be patient and let my stop, set at $39, work for me. At least that's the plan!

Saturday, December 16, 2006

Two Uranium Charts: CCJ and RTP

Uranium stocks have been on fire of late, bottoming in November and soaring towards intermediate highs. Two stocks that are on my watchlist are CCJ (Cameco Corp.) and RTP (Rio Tinto PLC). While RTP seems stronger, as the 50 day MA is pointing up and has crossed over the 200 day MA, I am a bit concerned about the RSI reading. Note that RSI at the late October highs was higher than the current RSI reading.


Now take a look at the RSI reading for CCJ. While price is still about a point away from the $42 intermediate high, RSI is higher than when it reached that level. This leads me to believe the stock will breakout from the intermediate high and challenge all-time highs which are at $45.


Due to the concerns with both stocks, I will likely wait for a breakout over resistance (CCJ at $42 and RTP at $230) on strong volume before entering, rather than making a riskier entry pre-breakout.

Bear on Wall Street Revisited

I like to play this clip whenever the bears are getting crushed, and this is one of those times. Watch this clip bears, but don't let it get you down. One of these days the market will do what it is supposed to do, and you guys will start to get some respect.


Song from the playlist:
Nelly Frutado channels vintage Madonna, only she does it better.


I'm looking at some sectors I normally don't trade, such as Uranium. I'm finding some nice looking charts that I will post tomorrow.

Thursday, December 14, 2006

Chart: AAPL

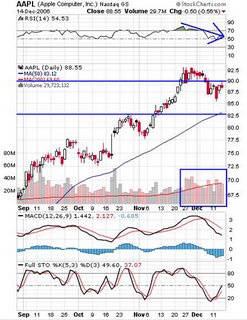
AAPL (Apple Computer, Inc) has been on my "shorts watchlist" every since it broke down below $90, and I made a tidy profit shorting it earlier in the week. While the stock has bounced off the week's low, it has not been able to mount the $90 area. The fact that AAPL did not participate in the run that many momentum and leadership stocks made today lends even more credence to the argument that AAPL has either formed a top or at least will test the 50 day MA.

Technically, take note of the down trending RSI reading and the pick up in volume as the stock consolidated and then broke down below $90. A bullish reading would have weak volume on the pullback.

There's a good chance I will short the stock again tomorrow morning.

Wednesday, December 13, 2006

Today's Trade: GG

I noticed that GG was bouncing off the 200 day MA, which also is at a nice price support area, so I bought 500 shares at $28.41.

Unfortunately my cold has turned into a nasty infection, so I likely won't be able to update my trades for another few days.

In the meantime, take a look at this post by Phil's Stock World. The guy actually uses Kepler's Third Law of Motion to analyze stocks! Put's my "keep it simple, stupid" style of analysis to shame :)

Tuesday, December 12, 2006

Feeling Crummy, Trades, Dr. Steenbarger and Iverson

I've been feeling like crap since late last week, so I have not been able to post my trades lately. A few positions I've taken over the past few days include: short AAPL, short RIMM, long USO, long SVVS, long FTO and long STLD. I hope to update the specifics of each trade in the coming days.

In the meantime, take a look at some of the most interesting research I've seen in quite some time. Brett Steenbarger, trading psychologist extraordinare, introduces us to hemoencephalography, "the measurement of voluntarily-controlled regional blood flow in the brain". We always here about elite athletes getting into the "zone". Well, traders can enter this state as well, and Dr. Steenbarger suggests how.

Speaking of athletes "in the zone", here is a tribute to Allen Iverson. It looks like this week will be the end of an era for Philly and Iverson. I'm keeping my fingers crossed that my T'Wolves can pull off the trade . . .

Sunday, December 10, 2006

Chart: USO

USO (United States Oil Fund) may be in the midst of printing a bottom here. The stock has been in free fall since the late August double top breakdown. However, this past week the stock pushed past 50 day moving average with an extremely strong RSI reading. A bullish flag formation is forming, although the volume on the downside is a concern. While entry here seems safe, the better bet would be to wait for a breakout over $55.

Thursday, December 07, 2006

Chart: RIMM

RIMM broke down below its mid-November gap level and looks ready for another leg down. If the stock holds below the $130 level, I will likely enter on the short side.

Wednesday, December 06, 2006

Today's Trades: REDF

I bought 500 shares REDF at $20.11. The stock had been setting up nicely and it made my watchlist last night with entry on a breakout of $20. Technically, the MACD has turned up and the 50 day moving average is pointing up and look ready to cross the 200 day moving average. My only concern is that RSI is not at the level it was when it hit $20 in late November.

Tuesday, December 05, 2006

Trades

Here is an update of trades I've made since Friday:

I bought 500 shares STLD at $32.50 yesterday, and sold today at $34.25 for an $875 gain (+5.3%).

I bought 500 shares of GROW as it broke $52.50 and sold at $54.30 for a $900 gain (+3.4%).

I bought 500 shares of TIE at $32.05 and sold at $32.90 for a $425 gain (+2.6%).

I covered 400 shares of AKAM at $49.10 for a loss of $348 (- 1.7%).

I went short 500 shares of LEH at $74.10. I am still holding (currently at a loss). My stop is set a little above the 50 day MA.

Today I went short 500 shares BRCM at $34.03. See last night post for the reasoning behind this trade.

I am still holding HAL, BOOM (short) and GG.

So Far, So Good

While today's action has made me take a step back and slow down on my "short tech and semi's thesis", I still think it's valid. While there were gains today, the volume just wasn't there for a lot of the stocks that I follow. For example, let's take a look at semi stock BRCM (Broadcom Corp). While the stock did make a nice gain today, it was on weak volume and the move did not pierce any resistance points. Right now, it looks to be setting up as textbook short off a reaction to a downtrend. If the stock does not break the 200 day MA tomorrow, I will likely short the stock.


So far, so good this week. Let's not overreact to one trading day. Nothing has changed to disqualify my view, and I am still very bullish energy, gold and metals, and bearish tech and semis.

I've made a number of trades over the few days and will detail them tomorrow, including STLD (profit), AKAM (loss), GROW (profit), GG (holding), BOOM (profit), LEH (loss), and TIE (profit).

Sunday, December 03, 2006

Am I Crazy? I Disagree With the Great Jesse Livermore

Today I was going over my my journal notes over the past twelve months. One of the things I always note when I log my trades is whether my trade went against the market and sector trends, and if the market is trending or range bound. Surprisingly,whether I traded with or against the market trend made little difference in my trade results. This took me back to a post I made to my old blog:

I am currently reading How to Trade Stocks by Jesse Livermore, one of the greatest traders the world has ever known. In the coming weeks I'll post some nuggets from the book. First off, here is a quote that many traders live by, but I tend to disagree with:

There are times when money can be made in stocks, but money cannot be
consistently made by trading every day or every week during the year. Only
the foolhardy will try it.

Basically, Livermore believed you should only trade individual stocks when the broader markets give signals and are trending (in either direction). The rest of the time you should be in cash. While I do agree that is the optimal time to trade, there are many ways to make money, and decent gains can be made in range bound markets. You just have to play the market differently. Livermore was a breakout trader, which works great for trending markets. Of course breakout trading isn't going to work as well in a market like we have right now, which is why you have to adjust your game plan accordingly. There is a lot of money to be made buying pullbacks of breakouts and playing support and resistance levels. Money that couldn't be made if you sat on your hands waiting for a trending market.

Mr. Livermore may call me foolhardy, but my portfolio hardy thinks I'm a fool :)

Saturday, December 02, 2006

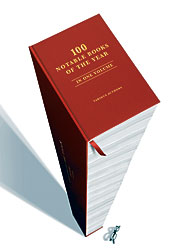
100 Notable Books of the Year

Studies show that reading everyday keeps the brain and memory sharp. Just like a muscle, if you don't use it, you lose it. For the past few years, I've made it a point to read a book for at least 45 minutes everyday. It might not sound like much, but by doing this, I have managed a little over one book per week. This year, I've read over 60 books.

The New York Times just published it's list of 100 Notable Books of the Year. There is something for just about anybody, so have a look and keep that brain functioning at a high level!

I recently picked up Programming the Universe: A Quantum Computer Scientist Takes on the Cosmos by Seth Loyd, and highly recommend it. I'm looking forward to Michael Lewis's The Blind Side: Evolution of a Game. Hopefully it will do for football what his other books did for Wall Street and Baseball.

Friday, December 01, 2006

Trades, Market Direction and Other Stuff

I sold half my position in GG at $31.05 (entry $29.07) for a $396 gain (+6.8%). I'll let the remaining shares ride until they hit my stop, and may add more if the stock pulls back to support.

I sold half of my HAL position at $33.95 for a $397.50 gain (+4.9%) . As with GG, I will let the remaining shares ride.

I covered half my short of BOOM at $28.86 (short at $30.32) for a $292 gain(+4.8%) . I will let the remaining 200 shares ride.

I came close to shorting BRCM, but decided not to pull the trigger.

The thesis for Friday is the same as the past few days, with what looks like a rotation into energy and metals from tech. The bounce over the past few days has got many pundits and bloggers thinking this dip was another buying opportunity. However, I tend to agree with Trader Mike's Falling Methods candlestick analysis. The bounce has not been as strong as the fall and looks ready to thrust down again. With the plethora of strong charts in energy and metals in the midst of the fall, I'm betting we'll see, at least in the short term, a repeat of what we saw a few quarters ago, with commodities gaining while equities fall. Time will tell.

Off Topic:
Flag Makeover


And the classic, So Smooth