Wednesday, November 29, 2006

Another Trade: GG

I went long 400 shares of GG at $29.07. The stock broke out over a 3 month cup and handle pattern and recently crossed over it's 200 day moving average. While I don't like to trade long stocks that have a 200 day MA that is above the 50 day MA, when the 50 day MA is pointing up at a steep level, as GG is, I make an exception to the rule. I also like the fact that the RSI is much stronger now than it was at higher price levels, which makes for a postive divergence.

If you look at today's trades (HAL, GG and short AKAM), it's rather obvious what I am seeing. It seems that money is flowing out of tech and into energy and metals. While it may seem odd that I made a gold play when other metals are outperforming, I am going on the thesis that gold stocks will catch up both to other metals and the underlying commodity itself.


Off Topic:

It's been a while since I posted any songs from my playlist. Here is Fray performing a great acoustic version of "Over My Head" at what looks like a local club.

Trades: JOYG, HAL and AKAM

Today I sold the remaining 200 shares of JOYG at $44.25 (entry at $42.73) for a $304 gain (+3.5%). The total gain on the trade was $758 (5.0%). I may consider re-entering on a breakout over $46. A breakdown below $42 would make for a good short entry.

Yesterday I went long 500 shares HAL at $32.36, with a stop just under $32 and an initial target of $34.

I also shorted 400 shares of AKAM at $48.23. The stock had broke down on decent volume under the 50 day MA and had been a laggart in its sector during the recent uptrend, so I was quite confident we were looking at a broken stock. However, the stock has bounced back strong today. I've still got a little room before having to exit, as my stop is placed just above $50.

Tuesday, November 28, 2006

Sectors and Stocks to Watch

I will be watching Broker Dealer, Internet, Semis and Homebuilders very closely this week. Each of these sectors took big hits today and many stocks are near breakdown of either trendlines or moving averages. We must also keep a close eye on gold and energy stocks. Will the "smart money" move into these sectors as the rest of the market breaks down? This is an important question to have answered for swing traders.

Stocks of interest include: LEH, SCHW, MS, GS, AKAM, JOYG, VRSN, LEN, DHI, INSP, YHOO, BRCM, HAL and GG. My "top ten" watchlist is full of *potential* shorts nearing confirmation, and a couple of longs.

Monday, November 27, 2006

No Posts Until Tuesday

My vacation is over and I'll be spending most of Monday catching up at work. Expect my first new post on Tuesday, when I plan to resume my "early rising" experiment.

Wednesday, November 22, 2006

Today's Trade: BOOM and JOYG

I sold half of my 400 share position in JOYG at $45 (entry at $42.73) for a $454 gain (6.3%). I still own 200 shares.

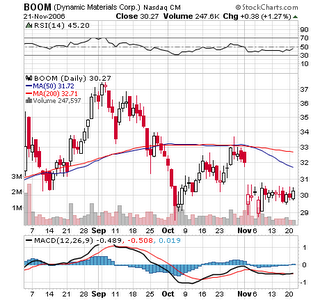
I went short 400 shares of BOOM at $30.32. As I've mentioned in the past, BOOM's supporting an ugly chart that makes for a nice short setup. The stock is below a 50 day moving average that is trending down further and further away from the 200 day MA. The stock has shown no sign of being able to close the gap it printed after its recent high volume downward spike, even in what has been a robust market. While a breakdown at $29 would be an ideal entry point, I think it's safe to play this one early, with a loose stop just above the pre-gap level, around $32.25.

Tuesday, November 21, 2006

Today's Trade: JOYG and AKAM

Although I am on vacation, my mind is never too far from the markets and I was able to make a couple of trades. Since I am not able to monitor my watchlists as close as I would like, I've narrowed my watchlists to only a few sectors and stocks, and probably won't expand the list until next Tuesday.

I sold all 400 shares of AKAM at $50.51 (entry at $48.35) for an $864 gain (+4.5%).

I bought 400 shares of JOYG at $42.73. The stock has been on a steady uptrend after what appears to be a bottom, and broke out on nice volume today. My initial target is $45-47.50.

Thursday, November 16, 2006

Will Rising Early Increase My Productivity: Part II

I don't think I've experienced an evening quite like the one I had last night in a long, long time. Since I completed my two main evening tasks in the morning, my evening was less regimented than the one I posted on Monday. During the time I normally work out, right after coming home from the day job, I read two chapters of Alan Farley's "The Master Swing Trader." This is an extremely dense book, and it's been on my "things to do" list since January. After eating dinner, playing and completing some learning activities with my daughter and watching "Friday Night Lights" (which is a great show about Texas high school football), I went into my office and decided to get organized. My motivation was Steve Pavlina's column on creating the optimal workspace. While categorizing all of my files and getting rid of the junk, I listened to the audio book of John Grisham's Innocent Man, which is the true story of a coveted baseball prospect who's life spiriled out of control and was wrongfully convicted of murder and sent to death row. Not to get to political on you guys, but anybody who believes in the death penalty should read this book. I'm all for "eye for an eye", but not at the risk of even one innocent man being killed. But I digress . . .

After a couple of hours in my office, I headed to the kitchen for a nightcap, which on weekdays consists of chocolate milk and a brownie. At about 10 am, I went to bed with the book I had worked on in the morning, "The 7 habits of Highly Effective People." A half an hour and about 45 pages later, I was out like a lightbulb. This was probably the earliest I had fallen asleep in I don't know how long. It feels weird going to bed without having my stock analysis ready, but I know I will be more efficient in the morning.

Efficiency results for day 1
What I normally accomplish as a night owl:
Work and Trading
Workout (aerobic and weights)
Stock Analysis (completed in almost half the time it normally takes)
Learning activities with daughter
Watched TV

Additional Stuff I normally could not accomplish as a night owl:
Read 135 pages of "The 7 Habits of Effective People"
Read 2 chapters of Alan Farley's "The Master Swing Trader"
Organize my office
Listen to audio CD of John Grisham's Innocent Man

My first day of rising early was easily the most fruitful day I've had all year. I can't believe how much I was able to get though. While day two was much of the same, sadly I'm going to have to put early rising on hold for about 10 days. I am leaving for vacaton tomorrow, and there is no way in hell I'll be getting up at 4 am on my vacation!

I will continue to chronicle my early rises when I get back. I'll have my laptop and access to wifi with me while on vacation, so I still plan to trade and post to the blog.

Today's Trade Update:
I sold half of my 400 share position in AKAM today at $49.45 for a $220 gain (+2.2%). I still own 200 shares.

I am watching semis, gold, oil, steel, internet, software and retail sectors closely. Stocks of interest include GROW, AKAM, AAPL, TIE, GG, SBUX, TIF, STLD, CHAP, VAL, XLE, XOM, HAL and YHOO.

Today's Trades: AAPL and AKAM

I sold 300 shares AAPL at $85.10 (entry at $83.10) for a $600 gain (+2.4%). If the stock can close above $85, which is a major resistance point, I may enter again tomorrow.

I bought 400 shares AKAM at $48.35. This has been a buy the dip stock, and today's strength leads me to believe yesterday was another one of those perfect dip entries. However, it's still a risky move and I may sell into strength. The stock is currently trading at $49.39.

Thanks for all the e-mails regarding my "early riser" post. I'll have an update on how my evening and morning went later today. So far, it's working out great, and I may end up making early rising permanent.

Wednesday, November 15, 2006

Will Rising Early Increase My Productivity: Part I

A reader took a look at Monday's "daily schedule" post and told me I should consider kicking the night owl habit. He pointed me to some articles by Steve Pavlina detailing how waking up early can increase your productivity. Although I feel like my schedule works for me, I've decided to give early rising a try. I normally go to bed between 2 and 3 am and wake up at 7 am (I know it doesn't sound like a lot of sleep, but I'm one of those oddities that functions well on 5 hours of sleep). Today, I woke up at 4 am. It was tough waking up, as I went to bed at my normal 2 am time, but I have to say, I can't believe how much I accomplished before going to work.

After waking up, I headed down to the basement and completed the 45 minute workout that I usually do after work. This was one of the best workouts I have had in quite a long time. My guess is it was because I was fresh and hadn't just logged in a full day of work and trading. After a protein drink and a bowl of cereal, I headed upstairs to go over my trading day. I had skipped my sector and stock reviews and watchlists last night, knowing I'd have time to do it in the morning. What normally takes me about 2 hours to complete at night, I finished in a little over and hour. I was amazed at the amount of intellectual clarity I was feeling and how fast the process went. Again, my guess is its because I was fresh and didn't have any distractions, such as the toddler asking for milk or the boob tube tempting me with yet another re-run of Everybody Loves Raymond.

By now it was 6 am, I had accomplished my morning goals and I had no idea what I should do. I don't leave for work until 8 am, and getting ready takes me about a half an hour. I decided to read a book that's been on my reading list for quite some time, Seven Habits of Highly Effective People. By 7 am I had read 90 pages of a book I had been trying to read for the past 4 months! After putting the book down, I decided to brainstorm about some ideas I have for a new blog. After a half an hour, I was back on my normal morning schedule.

So before the time I normally wake up, I was able to work out, complete my stock analysis, read 90 pages of a book and brainstorm blog ideas. Not only was the morning highly productive, my entire evening is open to new things now that I don't have to worry about working out or completing my stock research. Although I'll have to go to bed earlier, probably around 11 am, I now have more free time and increased my productivity by at least 50 percent.

I'll be back tonight or tomorrow morning to detail how my evening went.

Chart: AKAM

AKAM's (Akamai Technologies, Inc.) chart is giving mixed signals. RSI and Stochastics often move in tandem, but here we have RSI showing a negative divergence, while stochastics show no divergence and bullish looking higher lows. The best way to play this stock is to ignore the indicators and watch three key S/R levels. A breakout over $52 would provide a good bullish entry point at new highs. Bears should watch the 50 day MA at $48, but a better entry point for shorts would likely be a break below $46. AKAM's ascent was so swift that we dont' see strong support until $40. AKAM printed an NR7 today, so expect a move soon.

Monday, November 13, 2006

Chart: Negative Divergences in GROW

If I were a betting man, I'd bet that GROW (U.S. Global Investors, Inc.) is going to run out of steam any day now. The recent breakout to new highs has done so with lower volume, lower RSI and lower stochastic readings than its September highs. What we have here is a textbook example of negative divergence, which does not bode well for the stock, at least in the short term. I woudn't be surprised to see a pullback to support at $34. A break of that support level could send the stock down to $30.

An aggressive trader could short now with a stop placed a little above $40. This is a risky trade since, even with the divergences, price has yet to taper off and the stock is riding the upper bollinger band. However, it could payoff big and the actual dollar risk is minimal with a tight stop in place. The more conservative approach would be to wait for a breakdown of the $34 level before entry. An "in-between" method would be to wait for price to come back inside the upper bollinger band, right around $36. I'm not yet sure which approach I'm going to take, but I will be monitoring this stock closely.

Daily Schedule

I received an email today from a reader who is a part-time trader and is having a tough time fitting his nightly stock analysis in around his job and family responsibilities. Everybody has different responsibilities and schedules, so this may not be of much help, but here is my schedule for tonight, copied directly from my journal:

4:30-5:00: Drive home
5:15-5:30 : Work out (Treadmill, Chest and Triceps)
6:15-6:45: Dinner
6:45-7:30: Play and learning activities with daughter
7:30-9:30: Watch DVRed shows (Prison Break, Heroes and Studio 60)
9:30-11:30: Stock Analysis (Sector Watchlist, Stock Watchlist, Journal notes, read blogs and financial sites).
11:30-1:00 Watch DVRed Monday Night Football
1:00-2:00 Read God Delusion by Richard Dawkins
2:00-7:00 Sleep

DVR has been a huge time saver. I can get through a 1 hour show in only 40 minutes by skipping commercials and opening credits, and 3 hour football games only take about and hour and a half to get through. The disadvantage is I miss out on any funny commercials, but hey, that's what youtube's for . . .

Today's Trades: AAPL and BOOM, and Trading Therapy Link

I made two trades today, both from the watchlist I posted last night:

Long 300 shares of AAPL at $83.10.

Short 400 shares BOOM at $30.18.

I'll go into more depth tonight. It's not hard to tell from looking at the charts that AAPL is a winner right now and BOOM is a broken stock.

As many of you know, I firmly believe that trading psychology is as vital to a trader's arsenal as understanding charts and technical analysis. Here is a nice three part series detailing therapy techniques by Dr. Brett Steenbarger.

Part 1
Part 2
Part 3

Sunday, November 12, 2006

Monday's Watchlist

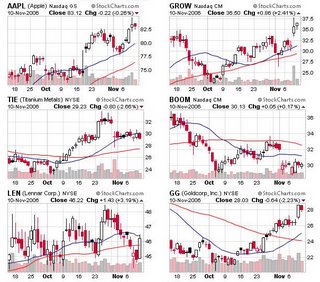
Here are six stocks on my radar for Monday: AAPL, GROW, TIE, BOOM, LEN and GG.

Friday, November 10, 2006

Is it time to play the commodity game?

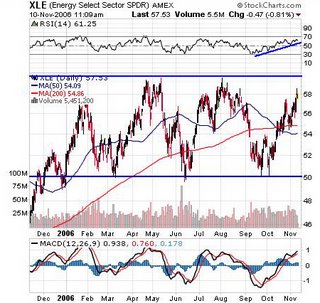
As I indicated earlier, this week I have been paying close attention to where the "big whigs" have been parking their money. Early indications seem to be that money is flowing out of tech, semis, housing and retail, and into commodities. Many commodity related stocks and ETFs have not only bottomed, but look ready to breakout from highs. For example, the Energy Select Sector SPDR, XLE, has made an 8 point move and is challenging all time highs at $59.50. A breakout over $60 could lead to big gains, as their would be no overhead resistance. However, failure at this level historically leads to a good shorting opportunity.


For those interested in playing commodities, check out this article by thestreet.com's Guy Lerner, and a thought provoking USO vs XLE comparison by Charles Kirk.

Thursday, November 09, 2006

Trades: AAPL, TIE, OII, LEN, NEM and emotions after a bad trade

I sold the remaining 250 shares of AAPL at $84.25. My average exit price for all 500 shares was $82.55, with an average entry of $78.77, for an $1890 gain (+4.7%).

I covered all 300 shares of OII at $41.50 (short at $36.05) for a $1635 loss (-13%). This is one of the worst trades I have made in a long time. I'll chalk this one up as a learning experience. The only saving grace is I went with a smaller than normal position size.

I covered all 500 shares of my TIE short at $29.20, for a gain of $720 (+4.8%).

I went short 500 shares of LEN (Lennar Corp.) at an average price of $45.05.

I am still holding NEM.

While I made $975 today (pre-commissions and tax), which is double what I made at the day job, i still feel miserable. Many head coaches have commented that the lows of losses far outweigh the emotions tied to winning. This picture of Dallas Cowboys head coach Bill Parcells says a thousand words. Right about now, I know every last one of them . . .

Sector Watch and BIDU Chart

It will be interesting to see where the money flows over the coming days. I am not going to make any guesses, but will monitor where the "smart money" ends up very closely. Here is a snapshot of nine sectors tracked by the S & P, courtesy of stockcharts.com:


BIDU (Baidu.com, Inc) has carved out a well defined trading range over the past few weeks. The more aggressive trader will see BIDU's recent tag of resistance as a failed breakout and go short. The more conservative approach would be to wait for a breakout over $97.50 for longs or a breakdown below $82.50 for shorts. Negative divergences in Stochastics and RSI make me bearish on this stock.

Wednesday, November 08, 2006

Kick Back and Relax With These Clips

I want to see how the market reacts to the Democrats winning the house before making any trades, so I'll probably lay low Wednesday. Of course, I'll be watching the trades that I have in play, but will let my stops take care of them.

In the meantime, check out these hilarious clips featuring Sacha Baron Cohen as Ali G and Borat:

Ali G - Religion


Ali G - Technology


Borat - Dating

Tuesday, November 07, 2006

Chart: TIE

TIE (Titanium Metals) has formed a classic bearish flag pattern after spiking down on heavy volume. While a conservative approach would wait for entry after a break of the flag's trendline, I decided to enter early. The fact that the stock broke down after an upmove on weak volume leads me to believe that this stock is broken and ready for a new thrust down. MACD, Stochastics and RSI all seem to confirm this point of view.

Quick Trade Update: AAPL, TIE, AKAM, NEM, OII, VLO

I went short 500 shares of TIE at $30.64.

I sold half of my long position in AAPL at $80.85.

I covered VLO at $51.57.

I was stopped out of my AKAM short yesterday at $47.65.

I am still holding NEM and OII (really bad trade), along with AAPL and TIE.

Tonight I will update these trades with charts, gains/losses and thoughts.

Monday, November 06, 2006

Chart: CENX

Many stocks in the aluminum sector look like they may have bottomed, and CENX (Century Aluminum Co.) is no exception. The stock has made higher highs in both price, stochastics and RSI, crossed above the 200 day MA, and the 50 day MA is now moving up. CENX is butting up against resistance, so I'm not ready to enter just yet. However, a breakout over $40 would be a good entry point.

Trading Psychology: Watch Yourself Trade Via an Out of Body Experience

We all have made trades that we've looked back on and asked ourselves, "how the schmuck could I have made that trade?" I can't count the number of times I have wished I could go back in time and tell myself not to make a dumb trade. Not because it didn't turn out the way I had hoped, as I am fine with losing small amounts on "good trades", but because the entry was flawed to begin with. Here is what I've done to combat this problem.

Before each trade, I try to relieve my body of all emotion and become as objective as I can. I close my eyes, get into a sort of meditative state, and project my conscious self into the upper corner of the room. Looking down at my physical self, I ask myself the following questions:

1. Am I following one of my setups?
2. Am I not chasing an entry?
3. Is the risk/reward favorable?
4. Would I tell my mother to make this trade?

If the answer to these four questions is "yes", I go ahead with the trade. I know it may seem laborous to do this before every trade, but it only takes about 10 seconds to complete this simple mind exercise. My entries have measurably imporved, while my penchant for risk taking, though not completely controlled, has been reigned in to a manageable level.

Friday, November 03, 2006

Trade and Chart: AAPL

If you are long AAPL (Apple Computer, Inc.), and think it can withstand a possible downtrurn in the market, this could be a nice entry point. Stochastics have reached oversold levels and price has pulled back to support on light volume.

I added another 250 shares at $78.25.

Today's Trades: CMED, BOOM, VLO, OII, NEM , AAPL, AKAM

I sold my 700 share position in CMED at $25.35 (entry at $25.15) for a $140 gain (+.8%) . The stock has had trouble breaking out over the 200 day MA, which leads me to believe it is ready for a pullback.

I covered my 500 share position of BOOM at $30.05 for a $1175 gain (+7.3%). I still feel the stock has room to fall, and may re-enter on weakness.

I've moved my stop on VLO close to the entry point of $51.85. Thus, this will end up being either a break even trade or a winner.

OII went against me in a big way. I entered at $36.05 and the stock has gapped up over $40. I've set a stop around $42, and am hoping the stock pulls back to the gap point, or at least support at $38. I'm lucky I went with a small position size here.

My other previous holdings include AAPL (long) and AKAM (short).

Finally, I bought 400 shares NEM (Newmont Mining Corp.) at $46.15. The stock has crossed over its 50 day MA and has moved up on nice volume with a strong RSI trend. I believe gold and mining stocks have some room to move, and my target for this stock is right around $50, close to the 200 day MA.


Thursday, November 02, 2006

Chart: AKAM

AKAM has been a momentum favorite, but is starting to show some chinks in its armor. The stock has leveled off since posting not so glowing earnings recently. A break below the 50 day MA ($46.18) could be the start of a fall back down to congestion at $40. I went short the stock yesterday.


Wednesday, November 01, 2006

Market Outlook and Today's Trades: AAPL, BOOM and AKAM

Market Outlook:
Well guys, the market is at a crossroads that could kill us if we are not careful. Is this market experiencing a necessary pullback that will look like a momentary hiccup a few months from now, or are we setting up for the nasty reversal that the perma-bears have been waiting for? My many years of experience as an all knowing trader have lead me to this answer: How the hell should I know?

I'm not a gambler, I'm a trader. Until the market tells me what to do, I'm not going to bet the farm in either direction. That said, even if the market does not reverse in a big way, I do think we get a pullback that is big enough to make some money on the short side. Therefore, my bias will be slightly short, emphasis on "slightly". Keep an eye on major support and resistance levels, along with the accompanying volume. Once you get the signal, then go "all in", while still using prudent position sizing and risk taking measures. Trader Mike provides charts of the three major indices with key support areas.

One last note on the markets. Notice that the bulls that have been preying on weakness were non-existant today? If this continues, we will be in for a fast and furious fall.

Today's Trades:
I went short 500 BOOM at $32.40. I got lucky on this one, as it traded down under $30 after hours. I am still short all 500 shares.

I went short 400 shares AKAM at $46.80. I might add to this position if the stock breaks below the 50 day MA, which is at $46.01.

I went long 250 shares AAPL at $79.30. I've been waiting for a pullback to the initial post earnings level, and finally got it. My stop will be just below $77.50.

Unfortunately I don't have time to post charts of these setups. I hope to go over these entries in the coming days.

King Bush Manipulating Oil Prices?

A little over a month ago I posted this chart (via USA Today) tracking Bush's approval ratings and gas prices. Here are some more links that raise the question of whether Bush, spearheaded by his croney and Goldan Sachs honcho Hank Paulson, is manipulating gas prices.


Friends in High Places

Approval at the Pump

Average Joe getting suspicious

CBS News joins the fray

U.S. News Wonders Why

Econobrowser on the Conspiracy

New York Times on Goldman's interest in manipulation

For those who don't subscribe to the Times

What does this all mean for us traders? Politics aside, if there is truth to this theory, it probably means my recent post about becoming an energy bull was a little early. I don't think the resistance levels I pointed out will break in the near future. If I were long oil, I would not enter until energy stocks break out over those major resistance levels.